Traffic visualization is about understanding how network flows move between VMs, hosts, clusters, and external networks. This is crucial for performance, troubleshooting, and security.
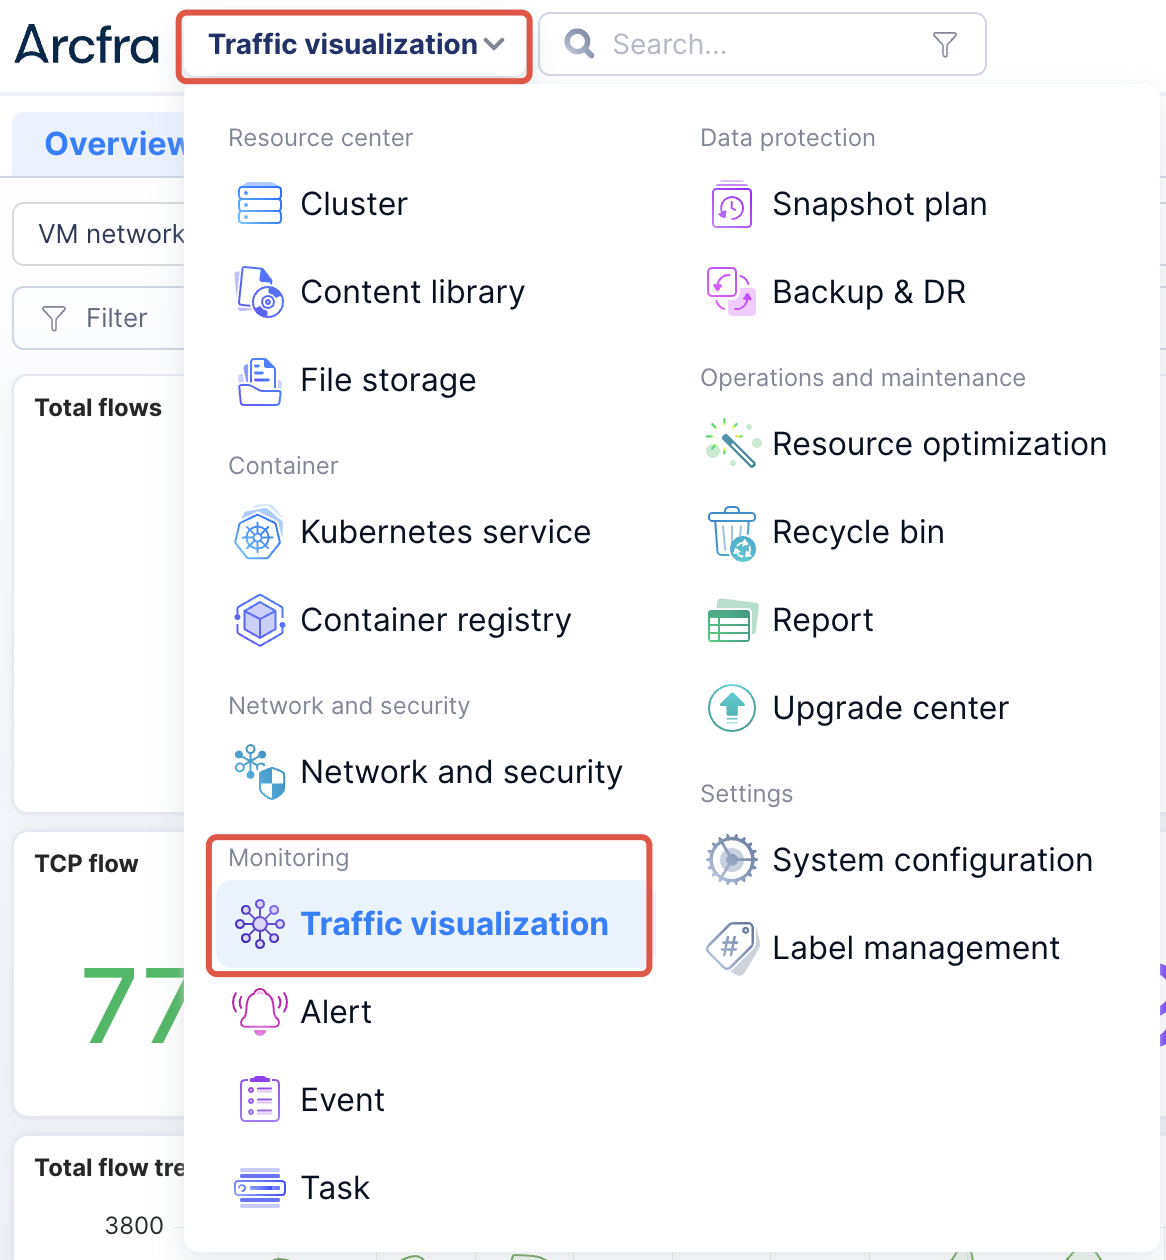
Select Traffic visualization in AOC to enter the traffic visualization page.
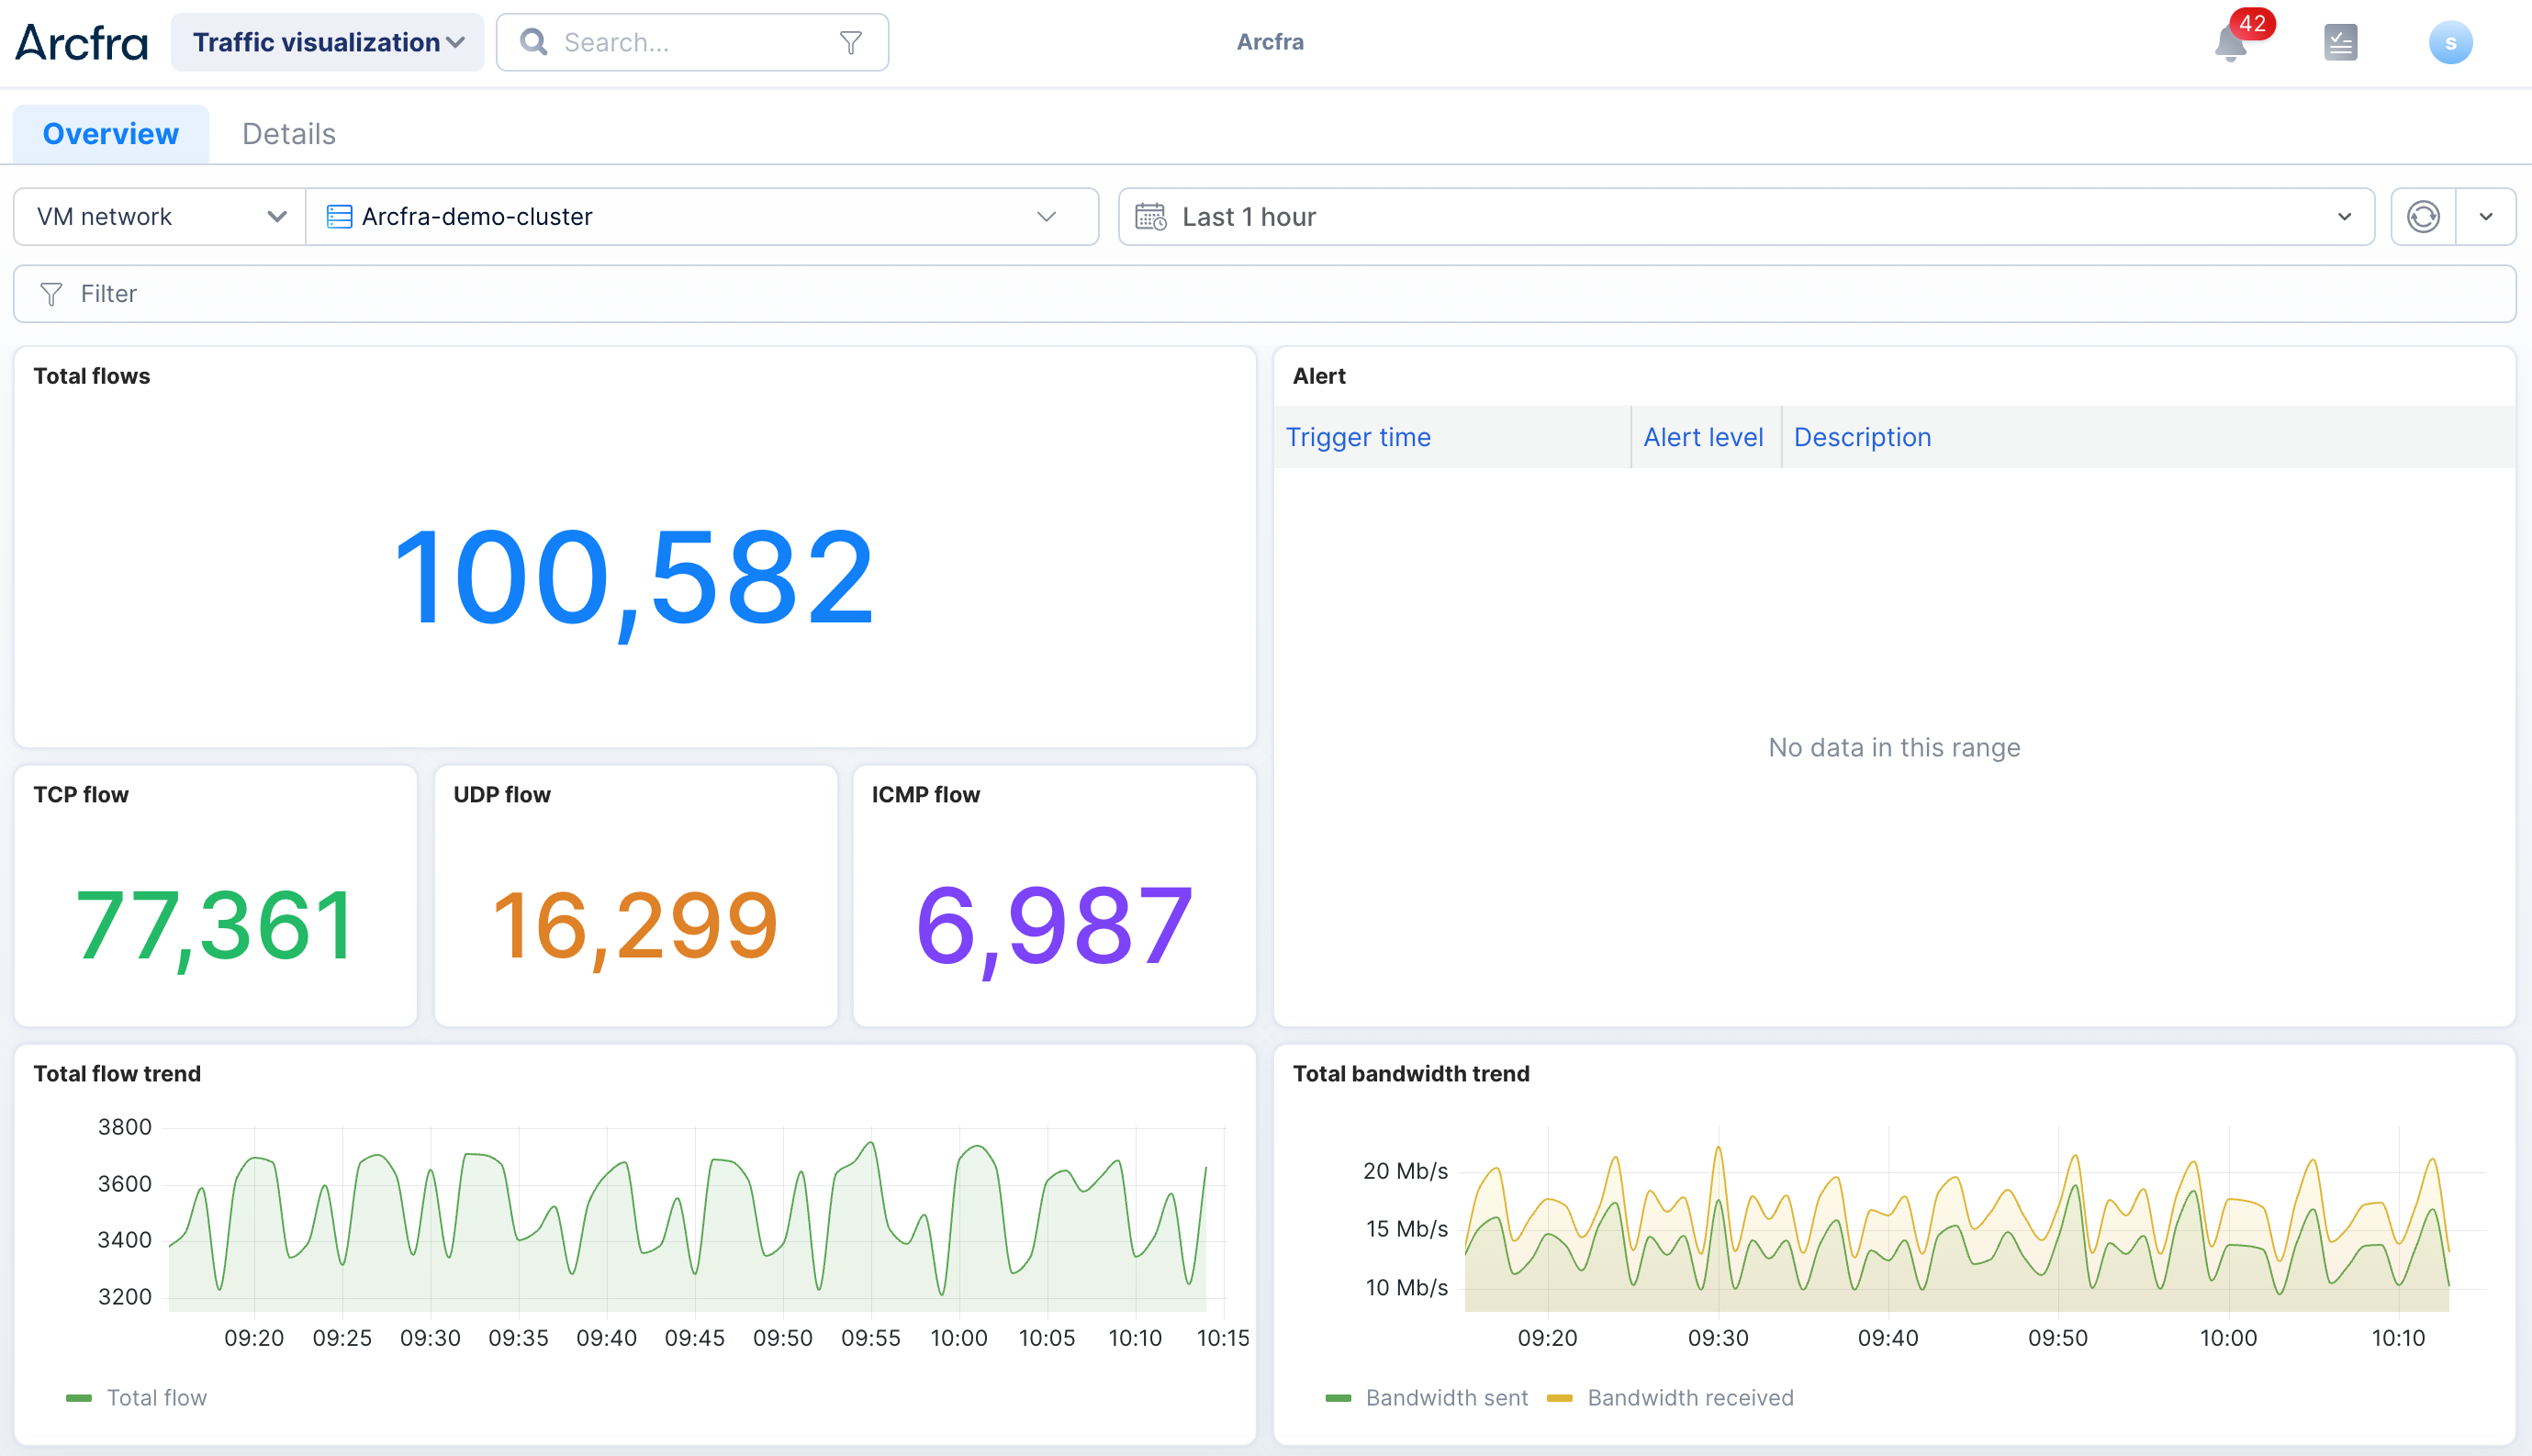
The Overview page provides statistical information on cluster flow, while the Details page provides specific flow information.
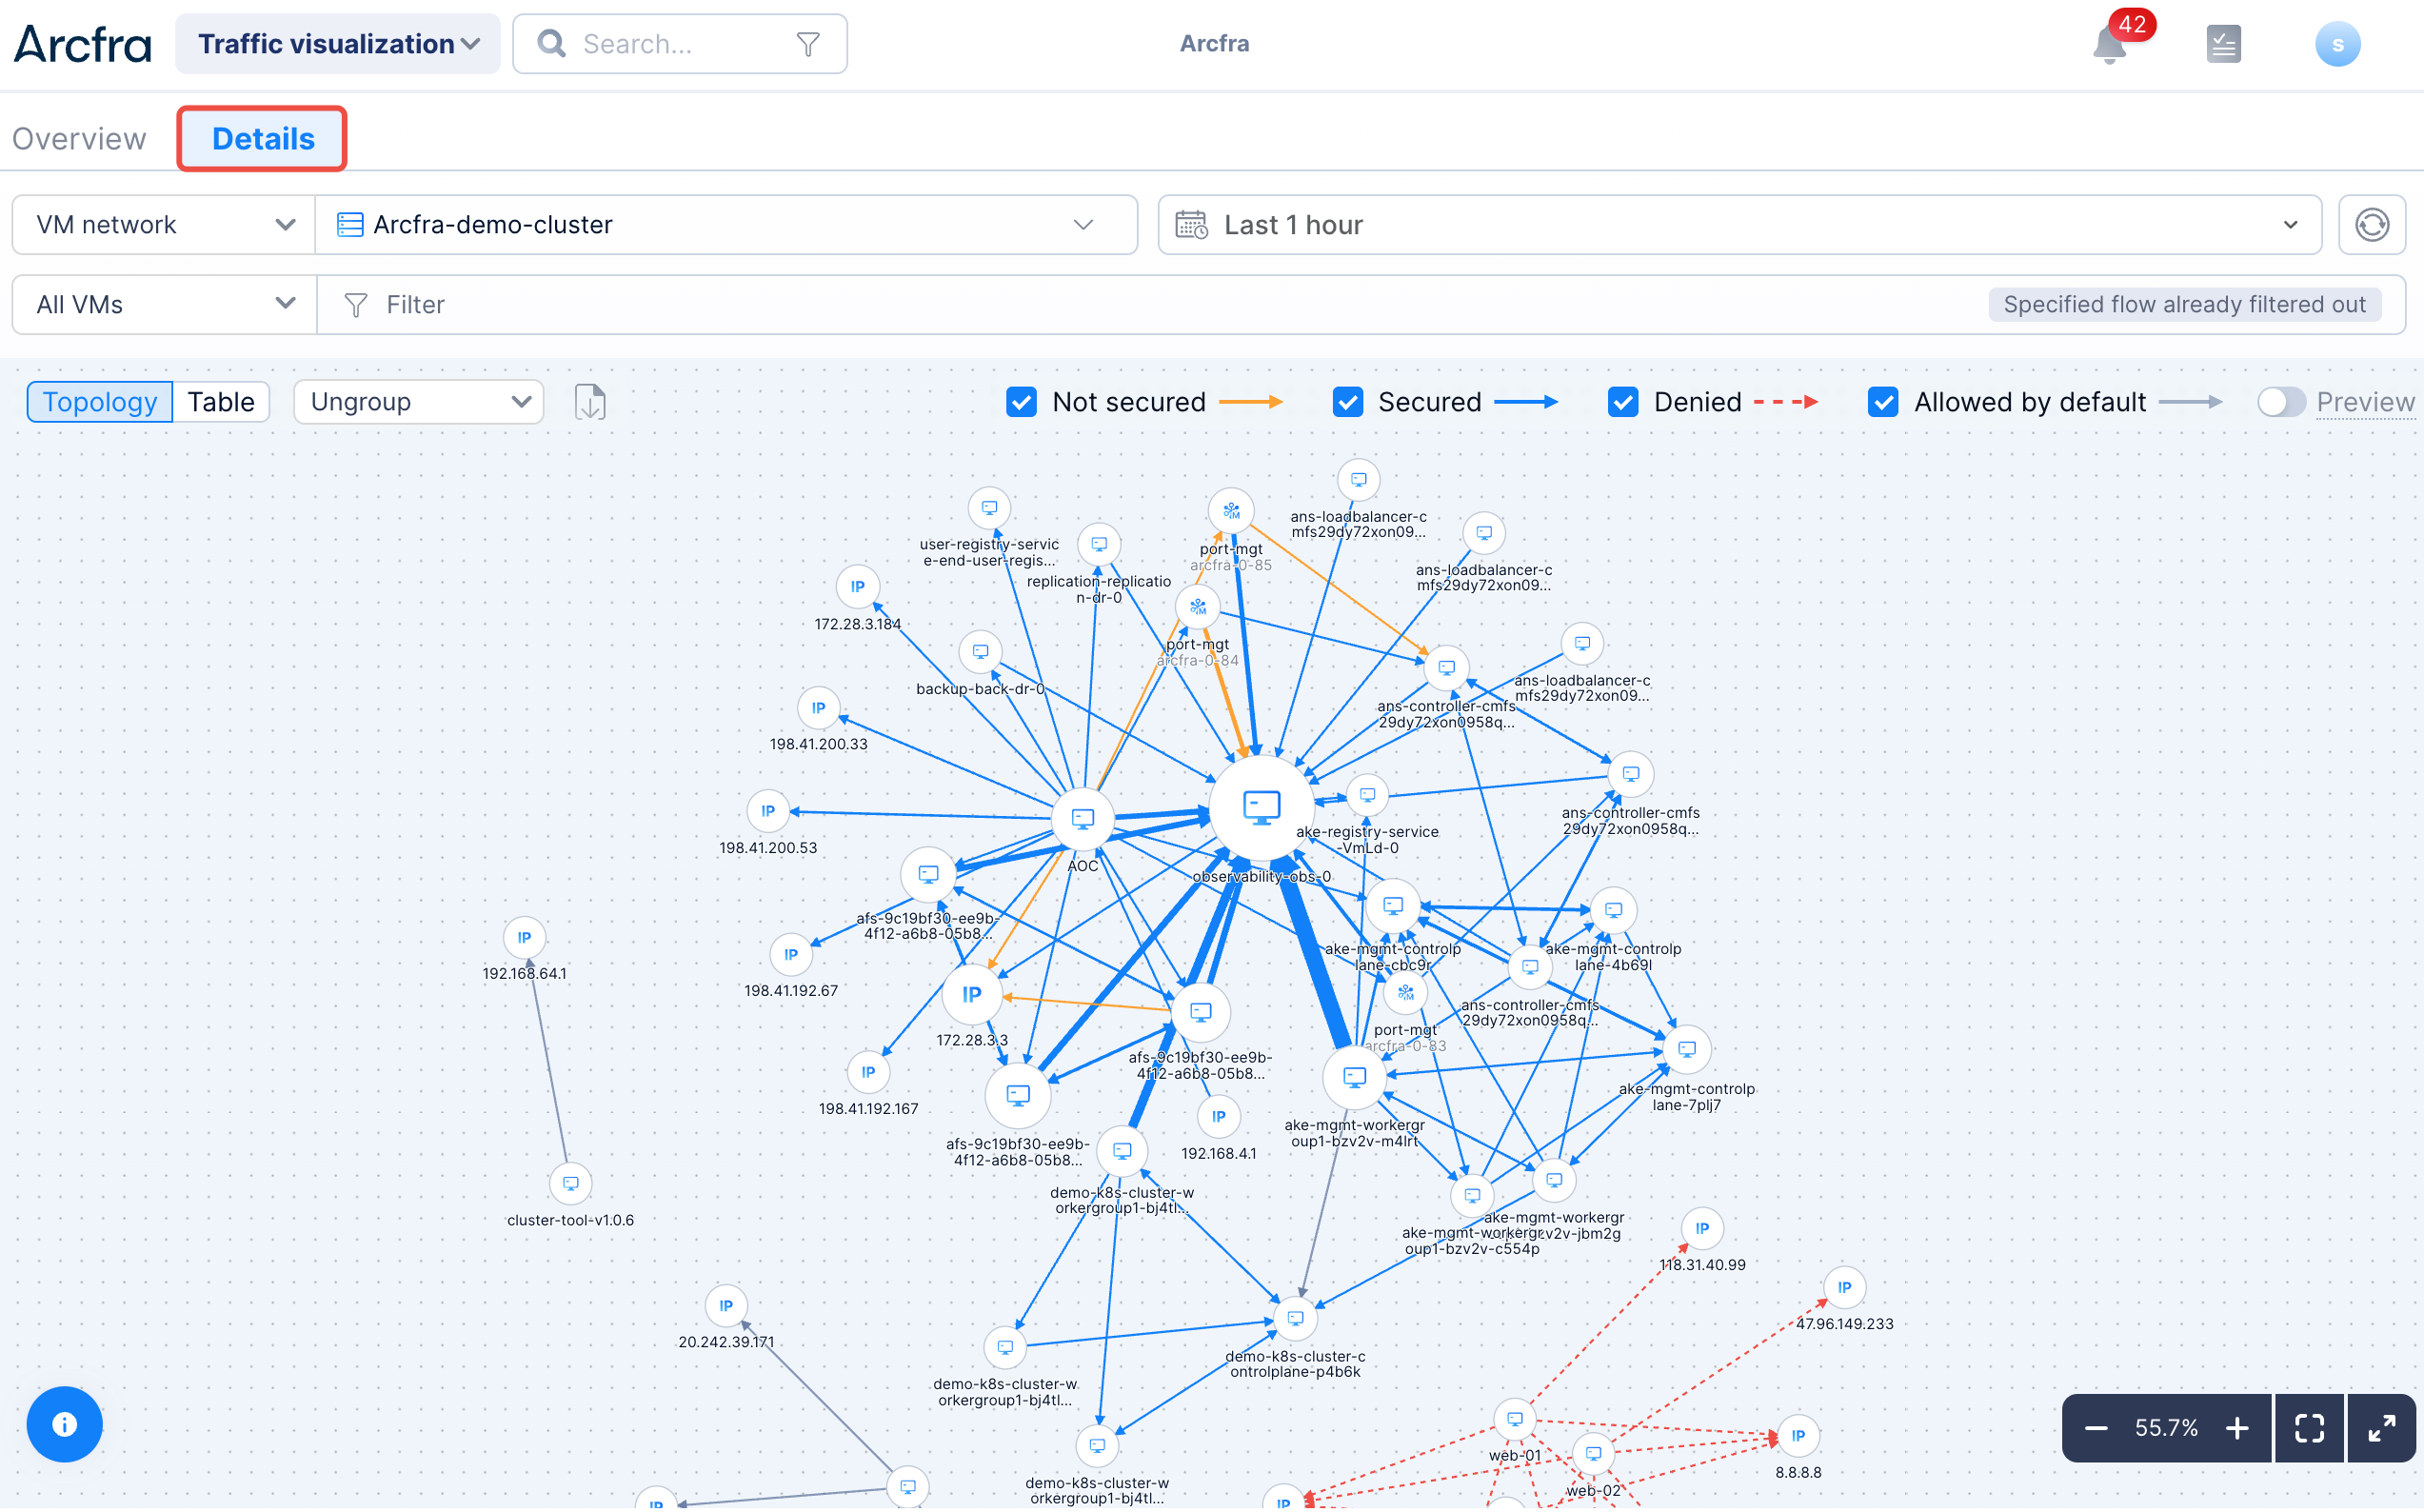
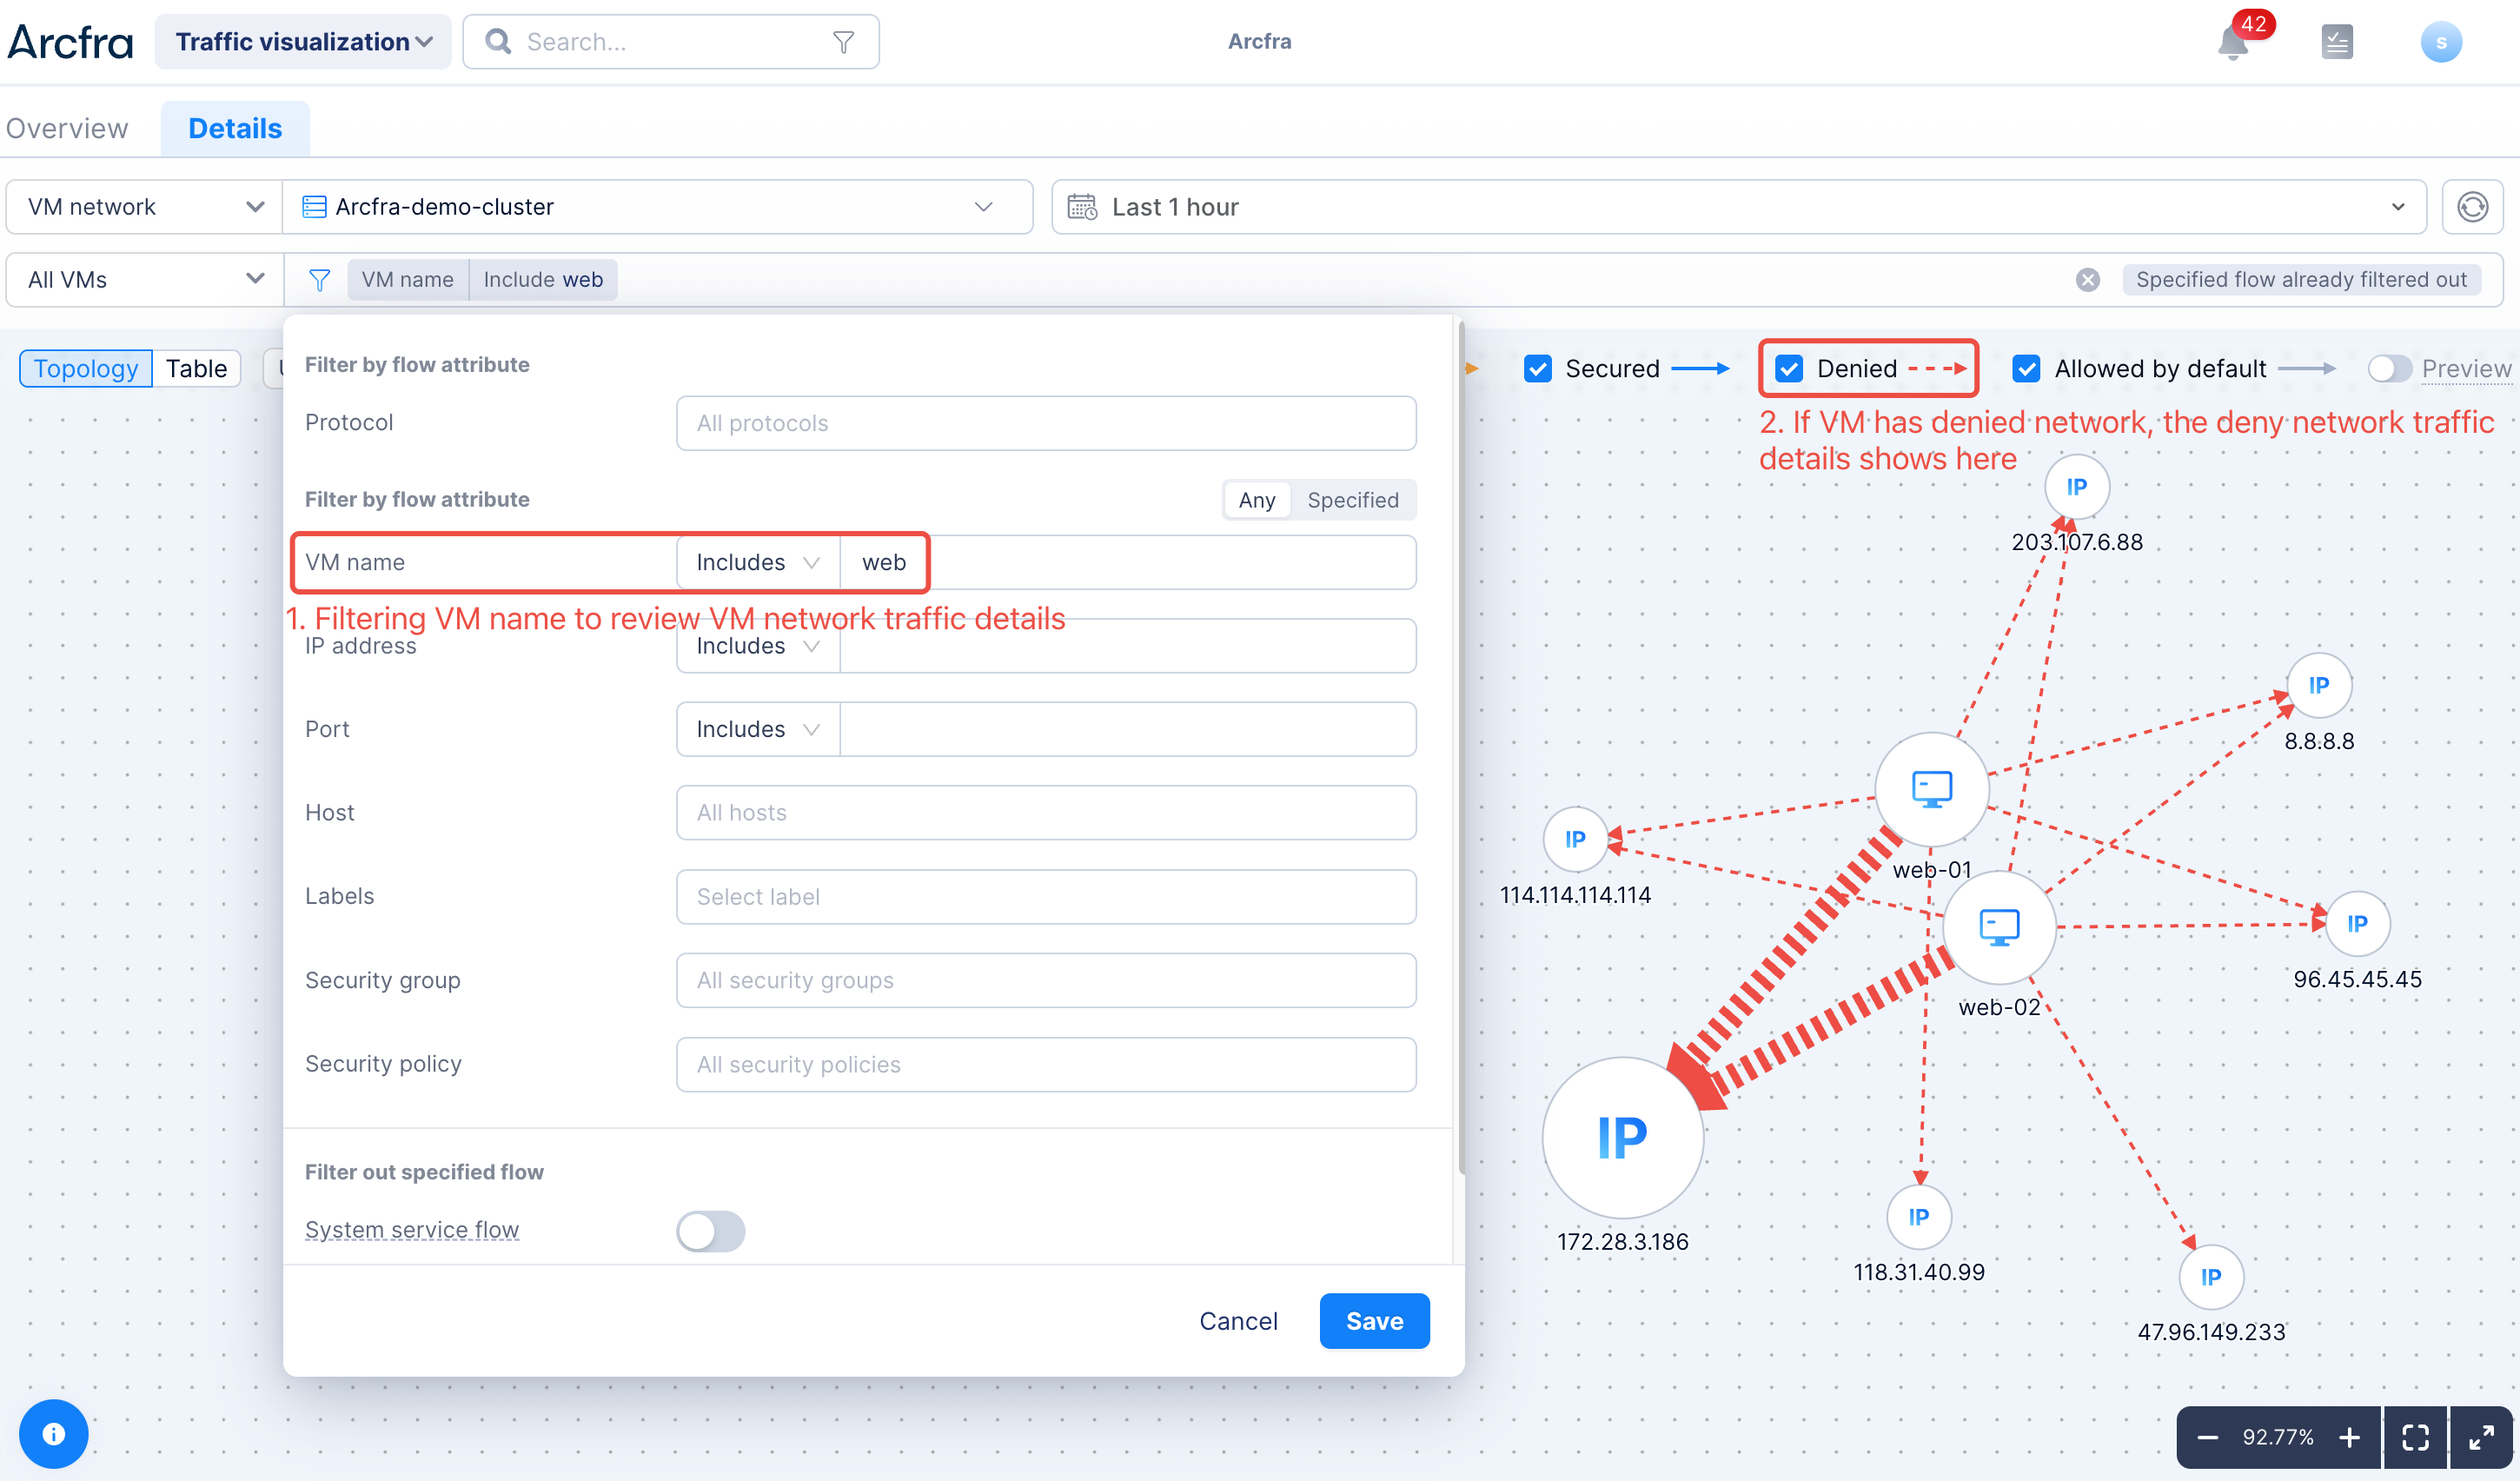
The Details page provides Filter VM network flows. Click on Filter icon  and input the VM name to show the network flows.
Click the  button to open the Export dataflow information window. You can use the default filename or customize it.
Next, Click Export, specify the storage location on your local computer, and export the details Information of selected dataflows.
